As data has become more prevalent from the rise of cloud computing, mobile devices, and big data systems, methods to analyze that data have become more and more advanced, with machine learning and artificial intelligence algorithms epitomizing the state-of-the-art. There are many ways to use machine learning to analyze data in Kafka. Below I will show how machine learning can be performed with Kafka Graphs, a graph analytics library that is layered on top of Kafka Streams.
Graph Modeling
As described in “Using Apache Kafka to Drive Cutting-Edge Machine Learning“, a machine learning lifecycle is comprised of modeling and prediction. That article goes on to describe how to integrate models from libraries like TensorFlow and H20, whether through RPC or by embedding the model in a Kafka application. With Kafka Graphs, the graph is the model. Therefore, when using Kafka Graphs for machine learning, there is no need to integrate with an external machine learning library for modeling.
Recommender Systems
As an example of machine learning with Kafka Graphs, I will show how Kafka Graphs can be used as a recommender system1. Recommender systems are commonly used by companies such as Amazon, Netflix, and Spotify to predict the rating or preference a user would give to an item. In fact, the Netflix Prize was a competition that Netflix started to determine if an external party could devise an algorithm that could provide a 10% improvement over Netflix’s own algorithm. The competition resulted in a wave of innovation in algorithms that use collaborative filtering2, which is a method of prediction based on the ratings or behavior of other users in the system.
Singular Value Decomposition
Singular value decomposition (SVD) is a type of matrix factorization popularized by Simon Funk for use in a recommender system during the Netflix competition. When using Funk SVD3, also called regularized SVD, the user-item rating matrix is viewed as the product of two lower-dimensional matrices, one with a row for each user, and another with a column for each item. For example, a 5×5 ratings matrix might be factored into a 5×2 user-feature matrix and a 2×5 item-feature matrix.
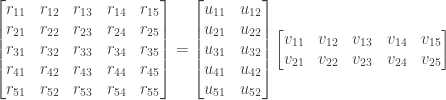
Matrix factorization with SVD actually takes the form of

where 
While Funk SVD can only accommodate explicit interactions, in the form of numerical ratings, a team of researchers from AT&T enhanced Funk SVD to additionally account for implicit interactions, such as likes, purchases, and bookmarks. This enhanced algorithm is referred to as SVD++.4 During the Netflix competition, SVD++ was shown to generate more accurate predictions than Funk SVD.
Machine Learning on Pregel
Kafka Graphs provides an implementation of the Pregel programming model, so any algorithm written for the Pregel programming model can easily be supported by Kafka Graphs. For example, there are many machine learning algorithms written for Apache Giraph, an implementation of Pregel that runs on Apache Hadoop, so such algorithms are eligible to be run on Kafka Graphs as well, with only minor modifications. For Kafka Graphs, I’ve ported the SVD++ algorithm from Okapi, a library of machine learning and graph mining algorithms for Apache Giraph.
Running SVD++ on Kafka Graphs
In the rest of this post, I’ll show how you can run SVD++ using Kafka Graphs on a dataset of movie ratings. To set up your environment, install git, Maven, and Docker Compose. Then run the following steps:
git clone https://github.com/rayokota/kafka-graphs.git

cd kafka-graphs

mvn clean package -DskipTests

cd kafka-graphs-rest-app

docker-compose up
The last step above will launch Docker containers for a ZooKeeper instance, a Kafka instance, and two Kafka Graphs REST application instances. The application instances will each be assigned a subset of the graph vertices during the Pregel computation.
For our data, we will use the librec FilmTrust dataset, which is a relatively small set of 35497 movie ratings from users of the FilmTrust platform. The following command will import the movie ratings data into Kafka Graphs:
java \
  -cp target/kafka-graphs-rest-app-1.2.2-SNAPSHOT.jar \
  -Dloader.main=io.kgraph.tools.importer.GraphImporter \
  org.springframework.boot.loader.PropertiesLauncher 127.0.0.1:9092 \
  --edgesTopic initial-edges \
  --edgesFile ../kafka-graphs-core/src/test/resources/ratings.txt \
  --edgeParser io.kgraph.library.cf.EdgeCfLongIdFloatValueParser \
  --edgeValueSerializer org.apache.kafka.common.serialization.FloatSerializer
The remaining commands will all use the Kafka Graphs REST API. First we prepare the graph data for use by Pregel. The following command will group edges by the source vertex ID, and also ensure that topics for the vertices and edges have the same number of partitions.
curl -H "Content-type: application/json" -d '{ "algorithm":"svdpp",
  "initialEdgesTopic":"initial-edges", "verticesTopic":"vertices",
  "edgesGroupedBySourceTopic":"edges", "async":"false" }' \
  localhost:8888/prepare
Now we can configure the Pregel algorithm:
curl -H "Content-type: application/json" -d '{ "algorithm":"svdpp",
  "verticesTopic":"vertices", "edgesGroupedBySourceTopic":"edges",
  "configs": { "random.seed": "0" } }' \
  localhost:8888/pregel
The above command will return a hexadecimal ID to represent the Pregel computation, such as a8d72fc8. This ID is used in the next command to start the Pregel computation.
curl -H "Content-type: application/json" -d '{  "numIterations": 6 }' \
  localhost:8888/pregel/{id}
You can now examine the state of the Pregel computation:
curl -H "Content-type: application/json" localhost:8888/pregel/{id}
Once the above command shows that the computation is no longer running, you can use the final state of the graph for predicting user ratings. For example, to predict the rating that user 2 would give to item 14, run the following command, using the same Pregel ID from previous steps:
java \
  -cp target/kafka-graphs-rest-app-1.2.2-SNAPSHOT.jar \
  -Dloader.main=io.kgraph.tools.library.SvdppPredictor \
  org.springframework.boot.loader.PropertiesLauncher localhost:8888 \
  {id} --user 2 --item 14
The above command will return the predicted rating, such as 2.3385806. You can predict other ratings by using the same command with different user and item IDs.
Summary
The Kafka ecosystem provides several ways to build a machine learning system. Besides the various machine learning libraries that can be directly integrated with a Kafka application, Kafka Graphs can be used to run any machine learning algorithm that has been adapted for the Pregel programming model. Since Kafka Graphs is a library built on top of Kafka Streams, we’ve essentially turned Kafka Streams into a distributed machine learning platform!